
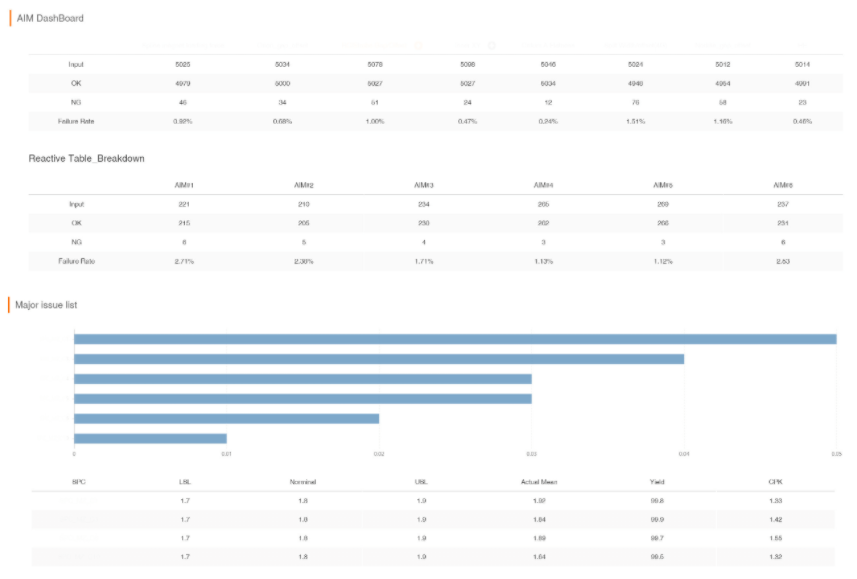
Quality Dashboard
Statistical analysis of each station and equipment yield, each point test yield.
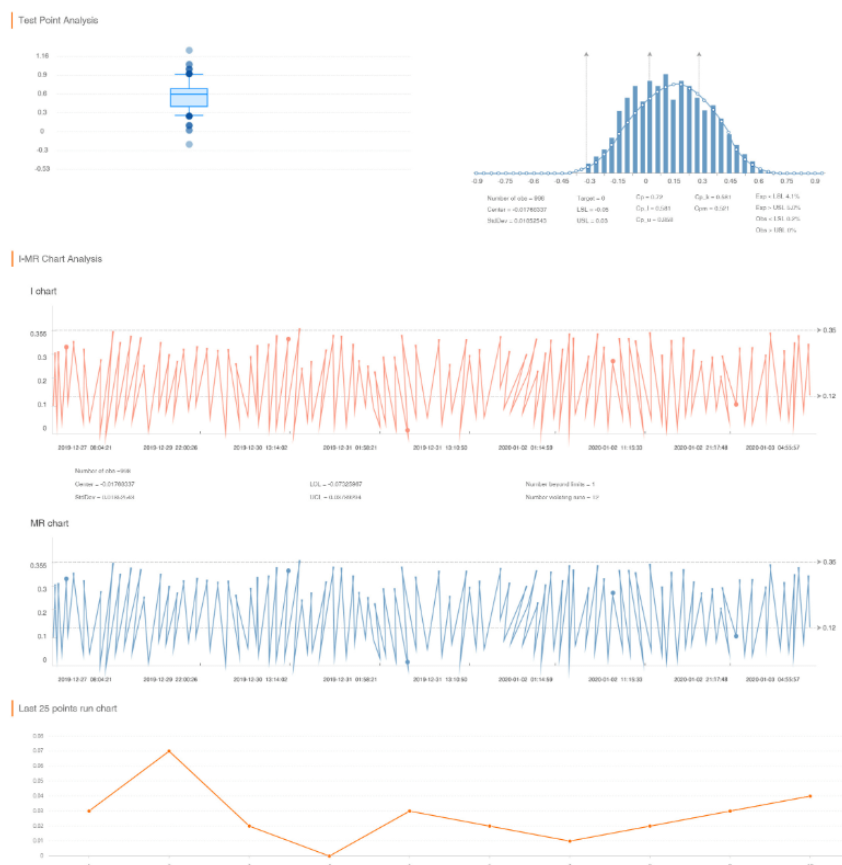
Quality commonness analysis
Statistics of the yield trend and comparison of automatic testing machines, as well as the distribution of SPC.
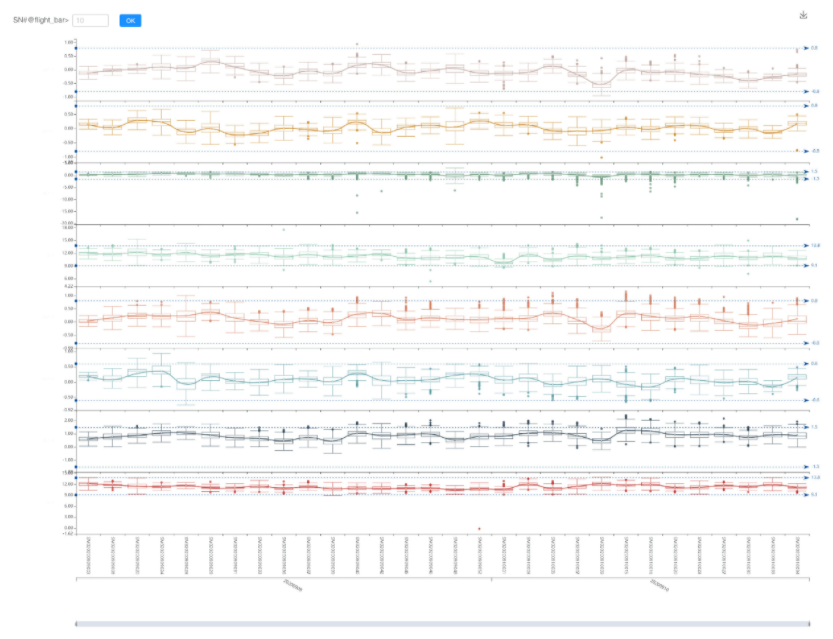
Quality SPC
Using statistical process capability analysis and six sigma statistical indicators to analyze the aim equipment inspection points.
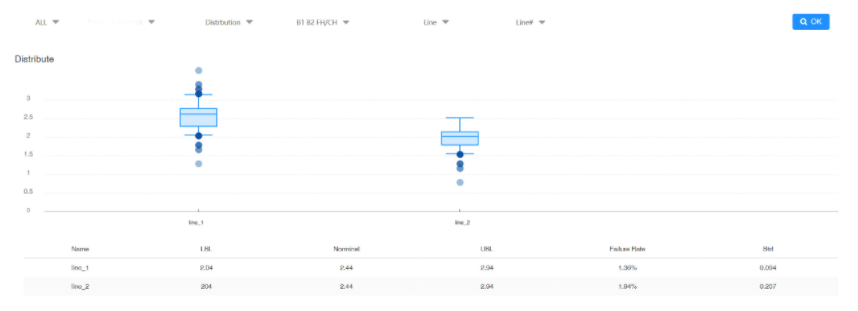
Quality customization analysis
Support the comparative analysis of the same type of test data;
Support to view the trend of box chart of each point;
The number of filter box line diagrams.